Quality of Service Monitoring
The Eluvio Content Fabric provides comprehensive real-time monitoring of the entire streaming pipeline from ingest of the contribution feed to playout by the end consuming client and a highly reliable and robust architecture. The uptime of the Content Fabric as a global full-stack media platform and CDN in year 2023 was 99.99% and the architecture’s inherently redundant, agile, end-to-end and partition-free design allows it to provide robust guarantees on performance and availability.
The gathered statistics are reported via a continuous monitoring API and are displayed on multiple UX tools available per Content Fabric tenant. In this case, [ Production Partner ]/Eluvio will manage a dedicated [ Content Provider ] tenancy on the Fabric containing all [ Content Provider ] streaming content. [ Production Partner ] and Eluvio operational staff will have direct access to all monitoring tools to support operations of each event, and [ Content Provider ] staff may choose to have login access as well. We detail each part of the monitoring pipeline and relevant UX tools below.
Monitoring through the Content Fabric
-
Streaming QoS Data and Metrics: The following statistics are gathered in real time and reported through the monitoring API for every live playable stream object
-
ingest - active status of the ingesting stream, active recording progress (stream time and bytes recorded and successfully published), ingest faults (source stream no longer sending)
-
transcoding and playout - segment serving time (average, max, and minimum, standard deviation, and 99 percentile metrics); active (successful) and failed playout sessions; filters by Fabric node and region; playout bitrate distribution
-
faults - number of failed playout requests and the error code/cause; filters by Fabric node and region
-
all metrics are logged directly within the Fabric nodes and aggregated periodically for persistent storage and query via REST/JSON APIs
-
-
Visualization / UX Monitoring Tools:
-
The Live Stream Manager displays the current status and health of all running streams and provides start/stop/reset control. It also provides a comprehensive live playout console for viewing and playing out any stream within a tenancy with filter options.
-
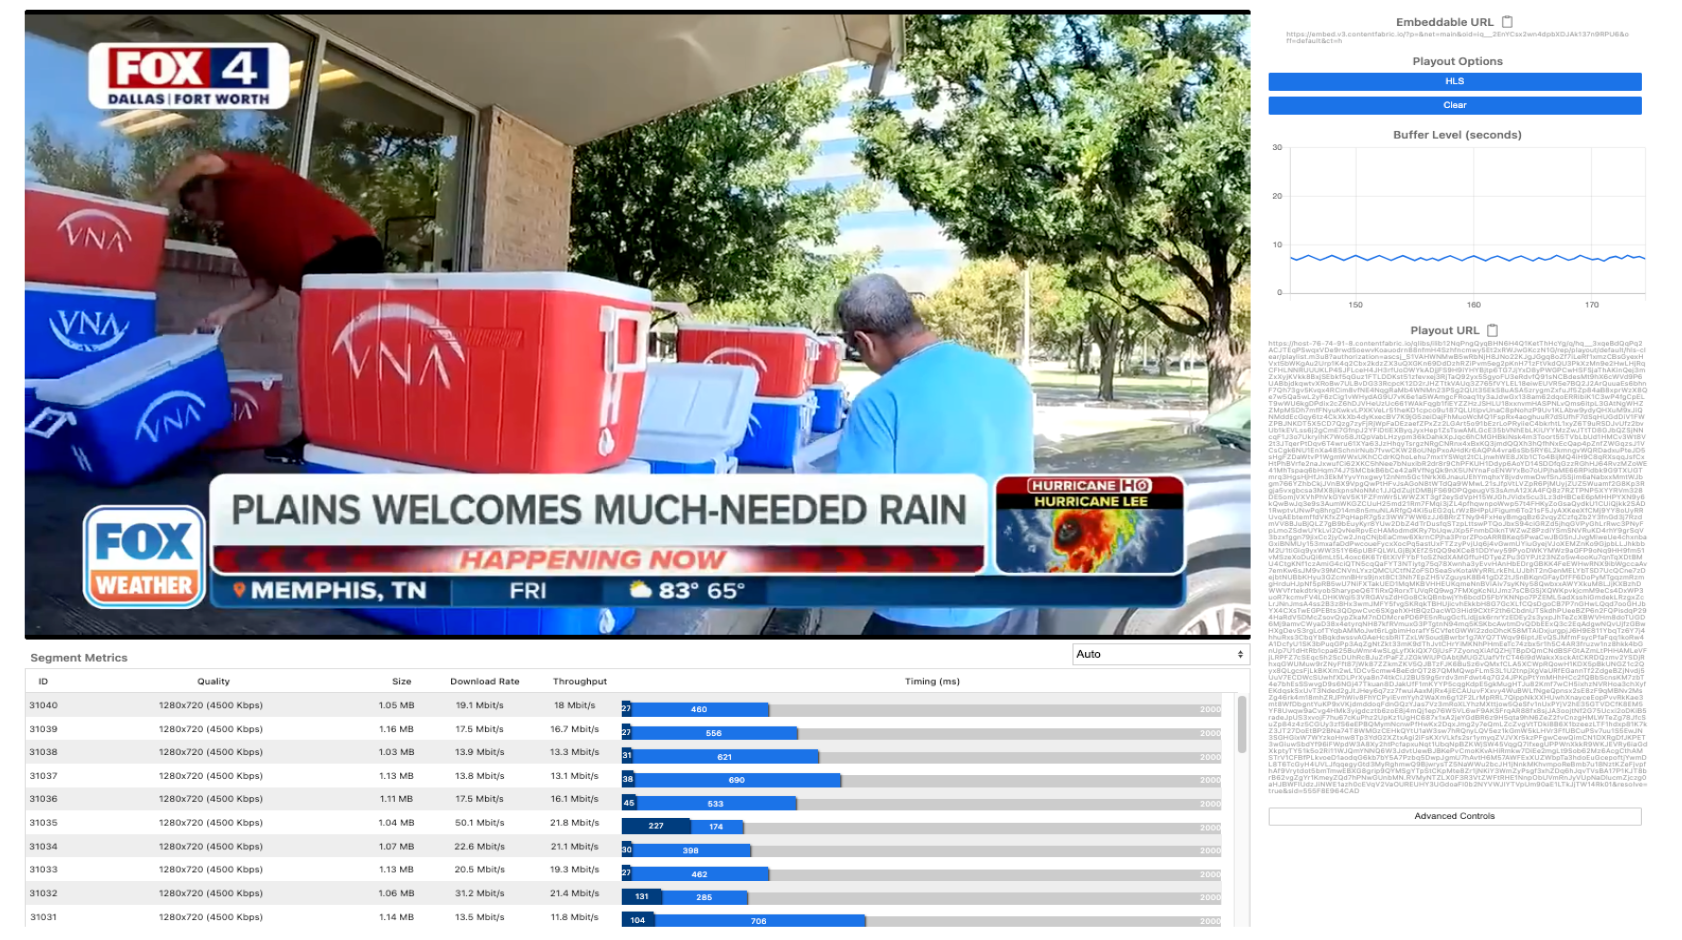
Picture Video Quality of Monitoring & End User Quality of Service - The per-stream drilldown in the Live Stream Manager allows for interactively viewing any stream as a client would, and continuously displays the time-to-first byte, segment arrival time, and player buffer statistics for the client. Advanced options allow for pinning the stream to a given Fabric node or to a specific playout profile for active troubleshooting during a live event.

-
-
The per tenant Analytics app (in development, to be released end Q1 2024) provides continuous reporting and graphing for the following streaming data.
-
Real time (last 60 minutes), last 7, 24, and 30 days, by Title
-
Views, Unique Viewers, Total Playing Time, and Average Playing Time
-
Fabric Delivery Status: average, max, min, and 99 percentile segment delivery latency
-
Also filterable by content object ID, version hash, and fabric region
-
Player stats as reported by MUX APIs including playback success, start up time, smoothness and video quality
-
Please note - The Analytics app is a real-time UX for reporting data currently provided in batch, offline. Fabric tenancies currently provide downloadable reports of all viewer playout sessions by Title/Stream in the Reporting area. Data includes Number of accesses/views and duration of playout (totals and by bitrate) for all playable content objects (titles, streams, interactive experiences). For downloadable types (e.g. files, images), bytes served per object. Individual user sessions including unique authorization address or wallet address, content object URL accessed, and user agent details including device platform/browser/client IP and client IP to geo resolution. These core reports can be accessed as exportable CSV or via the tenant reporting.